Beating torch.relu with FlyDSL: A Hands-On Guide to Bandwidth-Bound Kernels
The canonical version of this exercise is Simon Boehm’s CUDA matmul post: start with a naive kernel, climb an optimization ladder one rung at a time, measure every rung, end up near the vendor library. It’s the best thing written on the genre and you should read it.
This is the same exercise in one dimension. I wanted to learn FlyDSL — AMD’s Python DSL for authoring GPU kernels through an MLIR layout-algebra stack — and the thing newcomers bounce off in a layout DSL isn’t the arithmetic, it’s the addressing. A GEMM makes you learn a two-dimensional tiling hierarchy before you can compile anything. So I picked the smallest kernel that exists and took it as far as it would go: ReLU, y = max(x, 0). One axis. One max. Everything you have to understand is about where the data is, which is exactly the part FlyDSL is opinionated about, and none of it is hidden behind a blocking strategy.
Five versions, naive to tuned, each measured against torch.relu on an MI350X. At the shape I tuned on it goes 2865 → 7131 GB/s; the best single number anywhere in the sweep is 7280 GB/s, at a larger shape where v1 starts lower too. Against torch.relu that’s 1.04× at the shape I tuned on and 1.28× at best, on tensors large enough to be bandwidth-bound. Below roughly 200 MB of traffic it loses, for reasons that have nothing to do with the kernel and everything to do with launch overhead. The interesting part is how unevenly the speedup is distributed across the five steps.
TL;DR. ReLU is pure data movement — one
maxper element, no reuse, nothing to overlap — so there is exactly one figure of merit (achieved bandwidth) and a hard ceiling (~8 TB/s of HBM3E). Vectorizing to 128-bit copy atoms is worth 2.37× and takes you level withtorch.relu— passing it needs the buffer descriptors two rungs later. The three rungs after it are worth 5% combined at the shape I tuned on — and the two textbook ideas inside them, unrolling and non-temporal loads, both measured negative. One rung turned out to be worth 22%, but only inside a narrow band of working-set sizes that a single-shape benchmark would have missed entirely. Along the way, the layout API asks for a specific kind of test discipline: on a GPU, “the output is correct” and “the kernel is correct” are different claims, and only the first one is what atorch.allclosechecks.
All five kernels, the benchmark harness and the test suite are in flykernels — flykernels/relu/v1_naive.py through v5_nontemporal.py. Everything below was measured on an AMD Instinct MI350X VF (gfx950, CDNA4), flydsl 0.3.0, torch 2.14.0a0+rocm. Every number in the post comes from a single run of that stack.
Disclosure: I work at AMD, on GPU performance. This post is a personal learning exercise, written on my own time against public releases of FlyDSL and ROCm. Nothing here is endorsed, reviewed, or verified by AMD, and none of these numbers should be read as official performance claims for any AMD product — they are one person’s measurements of one machine, and a virtualized partition of one at that. The code is public precisely so you can run it yourself and disagree with me.
The machine, the ceiling, and how I measured
Before any kernel, the number it’s being graded against.
The MI350X is CDNA4 (gfx950): 256 CUs, 288 GB of HBM3E at a peak of ~8 TB/s, fronted by 256 MB of last-level Infinity Cache. That last figure looks like trivia right now. It is the entire explanation for v5.
ReLU does one max per element and touches each element twice — read it, write it. In bf16 that’s one flop per four bytes, an arithmetic intensity of 0.25. The MI350X does hundreds of TFLOPs. There is no version of this kernel that is compute-bound, no blocking scheme that helps, no reuse to exploit; put it on a roofline and it sits on the memory ceiling at every point. So the ladder has exactly one score:
GB/s = 2 · numel · sizeof(dtype) / secondsand one target: 8000 GB/s, which nothing reaches. torch.relu gets 6830 at 8192² bf16 — 85% of peak — and that’s the practical bar.
Timing. CUDA events around a loop of 100 iterations after 20 warmup runs, so per-launch event overhead amortizes and JIT compilation lands in the warmup (flykernels/bench.py). Every figure is the median of 15 such timings, taken round-robin so each implementation is re-timed once per round and drift hits all of them equally rather than whichever ran last.
The median matters more than it sounds. Both the kernels and torch settle into a tight steady state — the middle half of torch’s samples spans 0.25% — but every so often one comes back 10% slow. A short warmup or a mean instead of a median lets those cold samples move the answer by several percent, which is more than most of the rungs below are worth. I got this wrong the first time and had to remeasure the whole ladder. Treat anything under ~2% here as a tie, not a result.
One disclosure about the baseline. Every kernel here writes into a preallocated output, and torch.relu has no out= variant, so the timed torch call is actually torch.clamp(x, min=0, out=out). I’ve treated the two as the same kernel — correctness is checked against torch.relu itself — but I have not verified that they dispatch identically, so read “torch” in the tables as “clamp-to-zero into a preallocated buffer.” It’s the fair comparison for a kernel with an out= parameter; it is not literally torch.relu.
A note on the machine. This is an MI350X VF — an SR-IOV virtualized partition, not a bare-metal card. I have no bare-metal baseline to compare against, so treat the absolute bandwidths as specific to this configuration. The relative ordering of the five versions is what I’d expect to transfer.
Correctness. Two independent checks, and the second one is the reason Part 3 exists:
- Bit-exact equality against
torch.relu. ReLU is exact — a value is either passed through or replaced by zero — so there’s no excuse forallclose. NaN, ±inf and −0.0 included. - A guard region (
flykernels/checks.py). Allocate the output inside a larger buffer, fill the tail with a sentinel, run the kernel, assert the sentinel survived:
SENTINEL = -7.0

def guarded_output(numel, dtype, guard=8192):
    buf = torch.full((numel + guard,), SENTINEL, device="cuda", dtype=dtype)
    return buf[:numel], buf     # write into buf[:numel], then check buf[numel:]
Checking the output tensor tells you what landed inside it and nothing whatsoever about what landed outside. Three separate times in this exercise I had a kernel that passed check 1 and was still wrong: two were caught by check 2, and the third announced itself as a crash forty seconds into a benchmark. Part 3 walks through all three — plus a fourth that runs the other way, where check 2 passed and check 1 was the one that fired.
The ladder at a glance
bf16 8192×8192 — the shape I tuned on. Peak is 8000 GB/s.
| ver | kernel | what changed | GB/s | % of peak | vs torch | Δ vs prev |
|---|---|---|---|---|---|---|
| v1 | v1_naive | one element per thread | 2865 | 36% | 0.42× | — |
| v2 | v2_vectorized | 128-bit copy atoms | 6793 | 85% | 0.99× | 2.37× |
| v3 | v3_tuned | swept block size, unroll rejected | 6855 | 86% | 1.00× | +0.9% |
| v4 | v4_buffer | hardware bounds checking | 7075 | 88% | 1.04× | +3.2% |
| v5 | v5_nontemporal | non-temporal stores | 7131 | 89% | 1.04× | +0.8% |
| — | torch.relu | baseline | 6830 | 85% | — |
The shape of that table is the post. One rung is worth 2.4× and clears the vendor library by itself; the remaining three are worth 5% put together, and one of them is a negative result I shipped anyway. If you came here for a long optimization story, ReLU is the wrong kernel — and knowing that in advance, from the arithmetic intensity, is the skill worth having.
The one thing the table hides is v5, which reads as noise here and is worth 21% two shapes over. That’s Part 2’s punchline.
You’ve just read the setup and the scoreboard. The rest of the post is in three parts:
- Part 1 — The two ideas FlyDSL is built on. Trace-time versus run-time, and layout algebra as “columns of columns”. Everything else depends on these.
- Part 2 — The ladder. Five versions, what each changed, and what it measured.
- Part 3 — Testing a kernel, not an output. The three ways I got a correct answer out of an incorrect kernel.
Part 1 — The two ideas FlyDSL is built on
Your Python does not run on the GPU
@flyc.kernel does not execute your function on the device. It traces it — runs it once, on the host, at compile time — and records the operations into MLIR. What runs on the GPU is the recording.
So every value inside a kernel is one of two kinds, and confusing them is the source of most early friction:
| Kind | Examples | Behaviour |
|---|---|---|
| Compile-time | BLOCK_THREADS, vec, dtype | Real Python. if works, loops unroll, arithmetic happens now. |
| Traced | fx.thread_idx.x, fx.block_idx.x, X.shape | Placeholders. A Python if on one of these does not branch per-thread. |
This is why the vector width has to be chosen on the host and passed into the kernel builder: it determines the instruction encoding, so it must be a concrete number before tracing begins. A value that varies per call cannot participate. It’s also why fx.range_constexpr exists — a plain range() inside a traced function becomes an scf.for loop, not an unroll.
Layout algebra is “columns of columns”
FlyDSL never asks you to compute an address. Instead you repeatedly split an axis in two and pick a slice. There is one rule worth memorising:
logical_divide(t, K)builds a grid whose columns are the successive K-element runs oft.
Slicing with None keeps an axis whole; slicing with an index pins it. So slice(a, (None, bid)) means “keep every in-tile position, select tile number bid” — it takes a column.
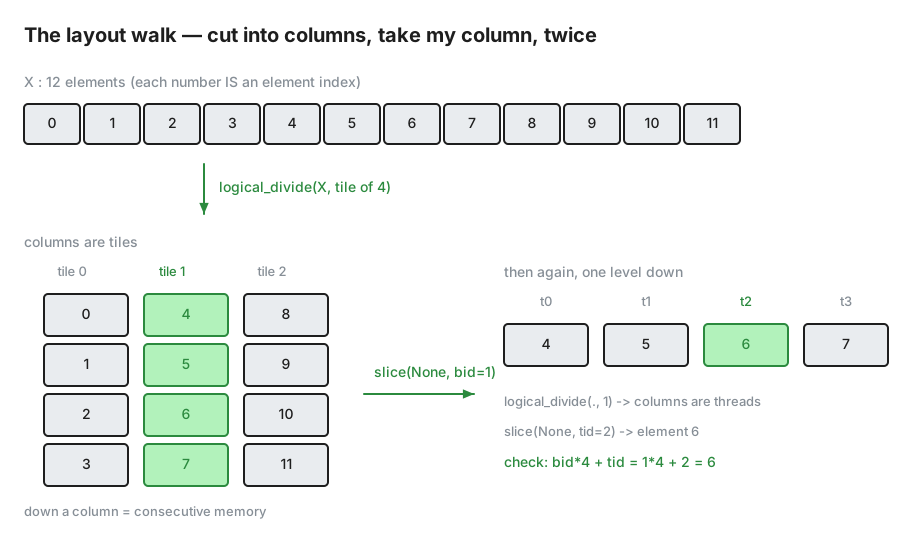
logical_divide cuts the tensor into columns, slice takes one, and the pair repeats one level down to reach a single thread's elements.In one dimension this is as concrete as it gets: logical_divide chops a ruler into equal segments, and slice picks one. Do it once to get from the tensor to a block’s tile, then again to get from the block’s tile to a thread’s elements. Cut into columns, take my column, cut into columns, take my column. That is the entire data path of the kernel, and it’s why the code below is two divides and two slices. In a GEMM you do the same thing on two axes at once with a hierarchy of tiles stacked on top — same algebra, four times the bookkeeping, which is why I’d rather you meet it here.
If your instincts are CUDA-shaped, the mapping is close to one-to-one:
| what you want | CUDA | FlyDSL |
|---|---|---|
| my block / thread index | blockIdx.x, threadIdx.x | fx.block_idx.x, fx.thread_idx.x |
| this block’s slice of the data | pointer arithmetic | logical_divide then slice |
| a 128-bit load | cast to float4 | a copy atom of 128 bits |
| registers to hold it | a local float4 | fx.make_rmem_tensor(vec, ty) |
| don’t run off the end | if (i < n) | pred=, or a buffer descriptor (v4) |
The layout ceremony looks like a lot for something this simple. It pays for itself in Part 2: when the vector width goes from 1 to 8, only the chunk sizes change — every divide and slice line stays byte-for-byte identical.
Part 2 — The ladder
v1 — naive, one element per thread
The goal here is a correct kernel and nothing else.
@flyc.kernel
def relu_kernel(X: fx.Tensor, Y: fx.Tensor):
    bid = fx.block_idx.x
    tid = fx.thread_idx.x
    numel = X.shape.unpack()

    base = bid * BLOCK_THREADS + tid
    in_bounds = fx.make_rmem_tensor(1, fx.Boolean)
    in_bounds[0] = base < numel

    tile = fx.make_layout(BLOCK_THREADS, 1)
    one  = fx.make_layout(1, 1)

    eX = fx.logical_divide(fx.slice(fx.logical_divide(X, tile), (None, bid)), one)
    eY = fx.logical_divide(fx.slice(fx.logical_divide(Y, tile), (None, bid)), one)

    atom = fx.make_copy_atom(ATOM[atom_bits](), elem_ty)
    rX = fx.make_rmem_tensor(1, elem_ty)
    rY = fx.make_rmem_tensor(1, elem_ty)

    fx.copy_atom_call(atom, fx.slice(eX, (None, tid)), rX, pred=in_bounds)

    x = fx.memref_load_vec(rX)
    zero = fx.full_like(x, 0.0)
    fx.memref_store_vec((x < zero).select(zero, x), rY)

fx.copy_atom_call(atom, rY, fx.slice(eY, (None, tid)), pred=in_bounds)BLOCK_THREADS, atom_bits, elem_ty and the ATOM lookup table all come from the enclosing builder function, which picks them on the host before tracing — that’s the compile-time/traced split from Part 1 in action. The full file has them; the snippet is just the kernel body.
Two details worth pausing on.
in_bounds is a one-element register fragment holding this thread’s “am I past the end?” flag. It is a tensor rather than a bare boolean because pred= expects one bit per copy atom, and in general a single copy call can drive several atoms. Here it’s the degenerate case: one atom, one bit. It stays degenerate in every version I shipped — v3 only stops being degenerate at UNROLL > 1, and the configuration that won the sweep was UNROLL = 1. The fact that the bit is per-atom rather than per-element is what case 1 runs into.
And the arithmetic is an ordered compare and a select, not a max — which is the line I had wrong the longest. maximumf(x, 0) looks obviously correct, and it does propagate NaN the way torch.relu does. But IEEE says maximum(-0.0, +0.0) is +0.0, while torch.relu(-0.0) returns -0.0: torch’s relu is a clamp, and -0.0 < 0.0 is false, so the input passes straight through with its sign intact. One input value out of the entire domain, silently different, and nothing but a test that specifically looks at sign bits will ever tell you.
Writing it as x < 0 ? +0.0 : x with an ordered compare fixes it and keeps the NaN behaviour for the same reason: ordered means NaN compares false, so NaN falls through unchanged — and so does -0.0. It costs nothing measurable. At 88% of the memory ceiling, one extra ALU op per element is free.
Result: 2865 GB/s — 36% of peak, 0.42× torch.
v2 — vectorize
Why v1 is slow: it isn’t bandwidth, it’s instruction count. Each thread moves 2 bytes per instruction in bf16. The memory system wants a full 128 bits per lane, so v1 issues eight times more instructions than necessary, each carrying its own issue cost and latency. At 36% of peak, the memory system is idling while the pipe drains address arithmetic.
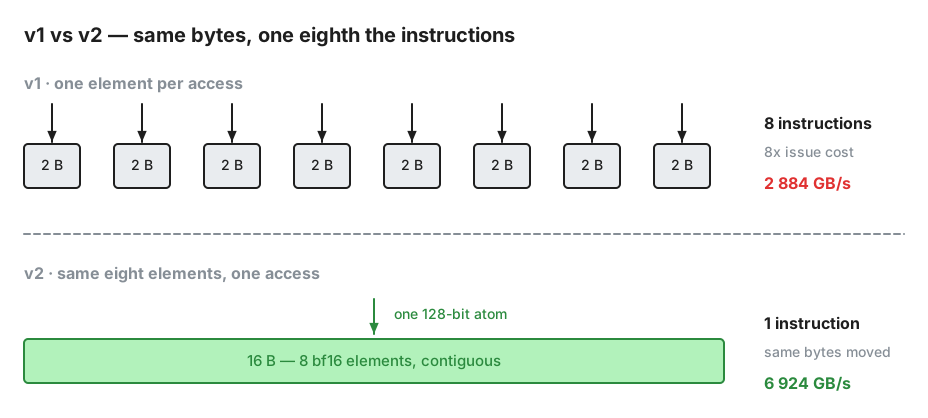
The fix is to give each thread vec contiguous elements — 4 for f32, 8 for bf16 — and move them in one 128-bit atom. Here the layout algebra earns its keep, because the change is entirely in the chunk sizes:
# v1
tile = fx.make_layout(BLOCK_THREADS, 1)
one  = fx.make_layout(1, 1)
atom_bits = elem_ty.width

# v2
tile = fx.make_layout(BLOCK_THREADS * vec, 1)
one  = fx.make_layout(vec, 1)
atom_bits = vec * elem_ty.width
Every logical_divide, slice and copy_atom_call line is untouched. So is the arithmetic — the compare-and-select is already elementwise, so it operates on an 8-wide value with no edit at all.
Result: 6793 GB/s — 85% of peak, level with torch’s 6830. A 2.37× step. This one change is the whole optimization story: it takes a kernel that was 2.4× slower than the vendor library and makes it an even match. The three rungs after it add 5% between them — but that 5% is the difference between matching torch and beating it, which is worth knowing before you decide the ladder is over.
v3 — unroll (a negative result)
Why v2 might be slow: each thread issues one load, waits on it, computes, stores. Latency is hidden only by occupancy. The textbook remedy is to give each thread several independent vectors and issue all the loads before consuming any, so a single thread keeps multiple requests in flight.
I built it, then swept threads-per-block against unroll factor:
| threads / block | unroll 1 | unroll 2 | unroll 4 | unroll 8 |
|---|---|---|---|---|
| 64 | 6928 | 6977 | 6821 | 6706 |
| 128 | 7022 | 6961 | 6744 | 6553 |
| 256 | 7007 | 6822 | 6624 | 6617 |
| 512 | 7057 | 6782 | 6579 | 6797 |
| 1024 | 6966 | 6628 | 6651 | 6814 |
Unrolling costs bandwidth in every row. The decline is not perfectly monotonic — at 64 threads U=2 edges out U=1, and a few of the deep-unroll cells recover slightly — but every row’s best cell is at U=1 or U=2, and no cell anywhere beats the un-unrolled configurations.
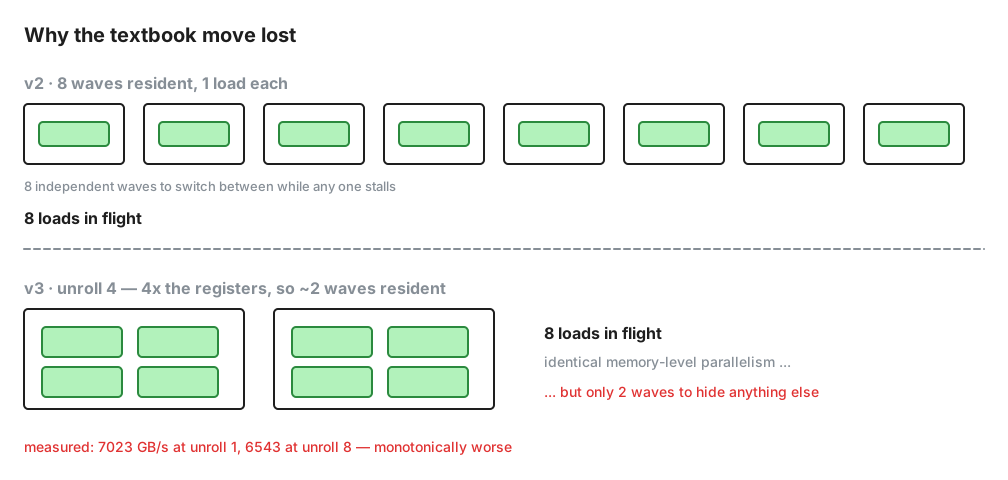
v2 was already at 86% of peak, so extra in-flight loads per thread buy nothing — while the register pressure and the correspondingly smaller grid cost real occupancy. Total memory in flight is roughly unchanged; the number of waves available to hide anything else drops by 4×. The premise was wrong: you can’t hide latency better on a machine that is already delivering nearly all the bandwidth it has.
The top of the sweep is a plateau, not a peak. The best cell is 512 threads at U=1 (7057), and 128, 256 and 1024 threads all land within 1.3% of it — which is to say, within the measurement’s own spread. There is no meaningful “best block size” here to find. v3 ships 128 threads and U=1, and end to end it lands 0.6% over v2, comfortably inside noise. I kept the version anyway. A rung that says “I tried the obvious thing and measured it losing” is worth as much as one that won, and the unroll machinery is what the sweep drives.
One implementation note that costs an afternoon if you miss it: blocks above 256 threads are rejected outright unless the kernel declares known_block_size, because the AMDGPU default max_flat_workgroup_size is 256. The 512- and 1024-thread rows above exist only because v3’s builder declares it. The error message names the exact fix, which is more than most toolchains manage.
v4 — let the hardware check the bounds
Why v3 is slow: every thread computes base = bid * tile + tid * vec, compares it against numel, materialises a predicate register, and carries that predicate into both copies. None of that is data movement. At 87% of peak the remaining 13% is exactly this sort of per-thread overhead, and the machine has a way to do it for free.
fx.rocdl.make_buffer_tensor wraps a tensor in an AMD buffer resource: a descriptor carrying a base address and a record count. Accesses through it are range-checked in silicon — an out-of-range load returns zero, an out-of-range store is dropped, with no branch, no predicate register, and no index arithmetic that can overflow.
That deletes in_bounds, both pred= arguments, and the base computation. The kernel gets materially shorter, and faster: 7075 GB/s — 88% of peak, 1.04× torch — the rung that actually passes the vendor library.
The cost is portability: fx.rocdl.* is CDNA-specific, so unlike v1–v3 this will not compile for RDNA. That’s the trade — hardware bounds checking for target neutrality.
It also has two traps in it, one hiding behind the other, which are case 3a and case 3b’s business.
v5 — non-temporal stores
Why v4 is slow: ReLU streams. Every element is read once and written once and nothing is revisited, so caching either stream is pollution — the lines are evicted long before anyone could reuse them, and they displace whatever else the cache was holding. CDNA buffer atoms take a cache modifier for exactly this: BufferCopy(bits, 0) is normal, BufferCopy(bits, 2) is non-temporal. I gave the load and the store separate atoms so they could be set independently:
| load | store | GB/s |
|---|---|---|
| cached | cached | 7062 |
| cached | non-temporal | 7093 |
| non-temporal | cached | 6245 |
| non-temporal | non-temporal | 6408 |
(These four are built directly from v5’s kernel builder rather than called through the JIT wrapper, so they isolate the cache hint. The cached/cached row lands near v4’s 7140, as it should — it is the same kernel.)
Half the theory held. A non-temporal store is worth +0.4% — inside the noise, which is what “this data is never read again” should look like. A non-temporal load costs 11%: the input stream evidently does want to pass through cache, presumably because prefetch and coalescing work on cached lines.
I nearly shipped that as another negative result. Then the full benchmark showed v5 beating v4 by 21% at one particular shape, reproducible across repeated runs and across two shapes. Sweeping the working set explains it:
| total traffic | v4 cached | v5 nt-store | gain |
|---|---|---|---|
| 134 MB | 4439 | 4445 | 1.00× |
| 201 MB | 6613 | 6648 | 1.01× |
| 268 MB | 7105 | 7158 | 1.01× |
| 403 MB | 6015 | 7261 | 1.21× |
| 537 MB | 6078 | 7320 | 1.20× |
| 805 MB | 6169 | 6315 | 1.02× |
| 1074 MB | 6168 | 6300 | 1.02× |
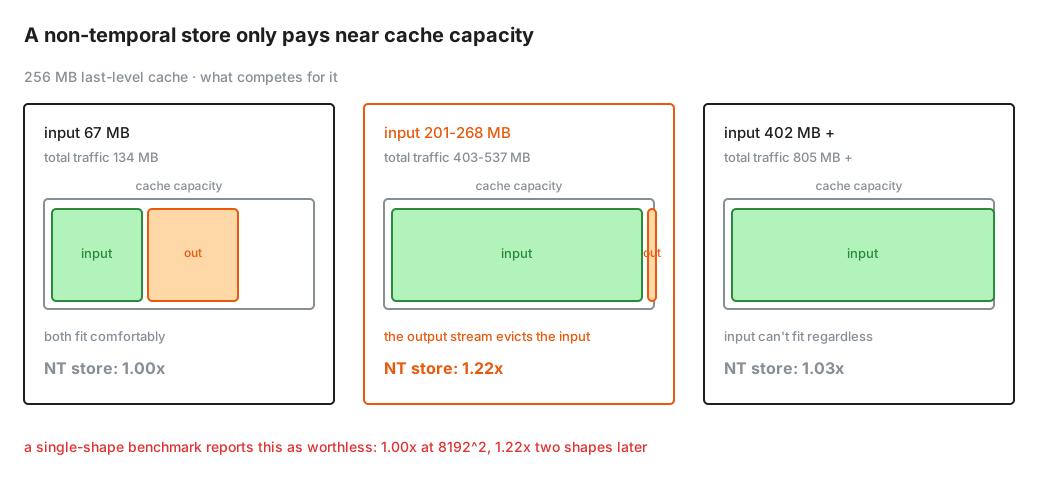
The gain exists only in a band — and the input footprint inside that band is 201–268 MB (half the traffic, since reads and writes are equal), which brackets the MI350X’s 256 MB of last-level cache almost exactly. Below it, the input fits comfortably even while the output stream pollutes the cache, so protecting it changes nothing. Above it, the input cannot fit no matter what you do. Right at the boundary, evicting the write stream is the difference between the read stream staying resident and being thrashed out.
I’d offer that as a hypothesis consistent with the data rather than a proven mechanism — I did not instrument the cache to confirm it. The transferable lesson is narrower and safer: a single-shape benchmark would have reported this optimization as worthless.
Where it landed
| shape (bf16) | v1 | v2 | v3 | v4 | v5 | torch | best ÷ torch |
|---|---|---|---|---|---|---|---|
| 8192 × 8192 | 2864 | 6810 | 6900 | 7078 | 7132 | 6833 | 1.04× |
| 16384 × 8192 | 2077 | 5911 | 6087 | 6127 | 7280 | 5700 | 1.28× |
| 32768 × 8192 | 2039 | 6063 | 6211 | 6236 | 6347 | 5651 | 1.12× |
| 4096 × 14336 | 2858 | 5951 | 6004 | 7015 | 7070 | 6509 | 1.09× |
The best number on the board, 7280 GB/s, is 91% of the 8 TB/s peak. 284 tests across the five versions, bit-exact against torch.relu on every shape and dtype, NaN, ±inf and −0.0 included.
Part 3 — Testing a kernel, not an output
A layout DSL hands you explicit control over addressing, and the flip side of that control is that a kernel can compute a perfectly correct answer while touching memory it doesn’t own. Three separate times in this exercise I had a kernel that passed a bit-exact comparison against torch.relu and was nonetheless wrong; the guard region caught two of those, and the third crashed. Then there’s the fourth, which fails the other way round and is the most interesting of the lot.
Each attaches to a specific rung, so here they are with their addresses:
| # | failure | rung | caught by |
|---|---|---|---|
| 1 | one predicate bit, eight elements | v2’s first draft | guard region |
| 2 | 64× over-launch, silent until int32 overflows | v2’s second draft | a crash, 40s into a benchmark |
| 3a | hardware bounds checking off by default | v4’s first draft | guard region |
| 3b | straddling access dropped, not clamped | v4, once 3a was fixed | value comparison — the guard region cannot see this one |
The shapes these take are worth recognising, so here they are in full.
1. One bit cannot describe eight elements
The predicate is one bit per atom. At the tail of a tensor, a thread’s 8-element vector may be half valid, and there is no way to say so.
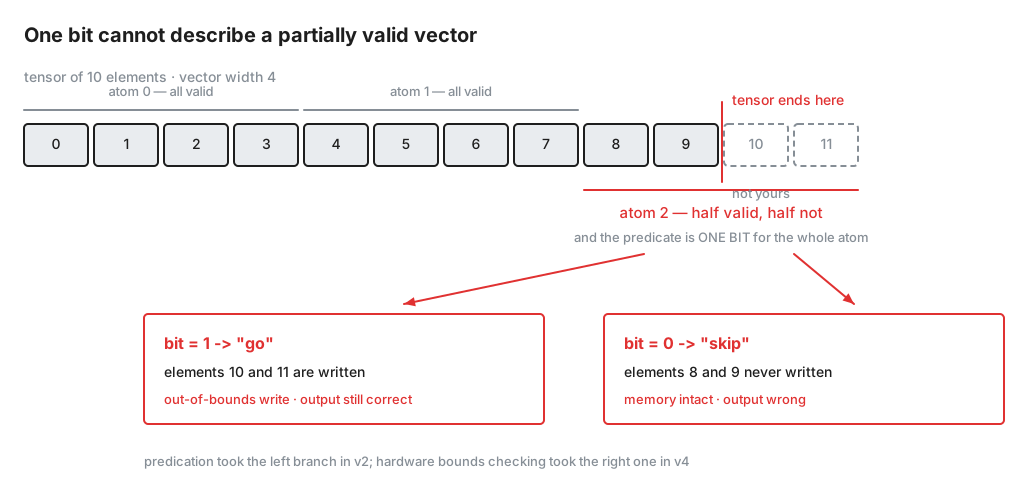
My first v2 hardcoded vec = 8 and did exactly this on every size not divisible by 8: correct output, 21 failing guard tests. The fix is a width that always divides the extent:
def pick_vec_width(numel, elem_bits):
    vec = 128 // elem_bits
    while numel % vec:
        vec //= 2
    return vec
It costs nothing on real tensors — activation sizes are highly composite, so vec stays at maximum — and engages exactly where you’d otherwise corrupt memory. It buys natural 16-byte alignment for free too.
2. The over-launch that was harmless until it wasn’t
My second v2 had a missing pair of parentheses:
grid_x = (numel + BLOCK_THREADS*vec - 1) // BLOCK_THREADS*vec # (… // 256) * 8Python reads // and * left to right, so this divides by the thread count and then multiplies — launching 64× too many blocks. Every excess block computed its predicate, found itself entirely masked, and exited. Results stayed correct. It was pure waste, and invisible.
Until the tensor got large enough:
| 32768 × 8192 bf16, 268M elements | |
|---|---|
| blocks launched | 8,388,664 (should be 131,072) |
| highest thread index | 17,179,983,864 |
| int32 max | 2,147,483,647 |
The index wraps negative, which makes base < numel true, so a block that should have been entirely masked fires its copy at a garbage address: CUDA error: an illegal memory access was encountered, forty seconds into a benchmark run.
Widening the atom in v2 didn’t create that bug. It just pushed the arithmetic over 2³¹ and turned silent waste into a crash. The predicate had been quietly doing the grid calculation’s job, and the tests it passed were real tests.
3a. A bounds check that is off by default
v4’s first attempt failed the guard tests exactly like an unpredicated kernel. The reason is in the signature:
def make_buffer_tensor(tensor, max_size: bool = True, ...):
    """Construct a new buffer-resource-backed tensor ... for hardware
    OOB-checked loads / stores ...

    ``max_size=True`` (default) sets the descriptor to ``0xFFFFFFFF``.
    """
The function advertises hardware OOB checking and defaults to a descriptor spanning all of memory, which checks nothing. You need max_size=False.
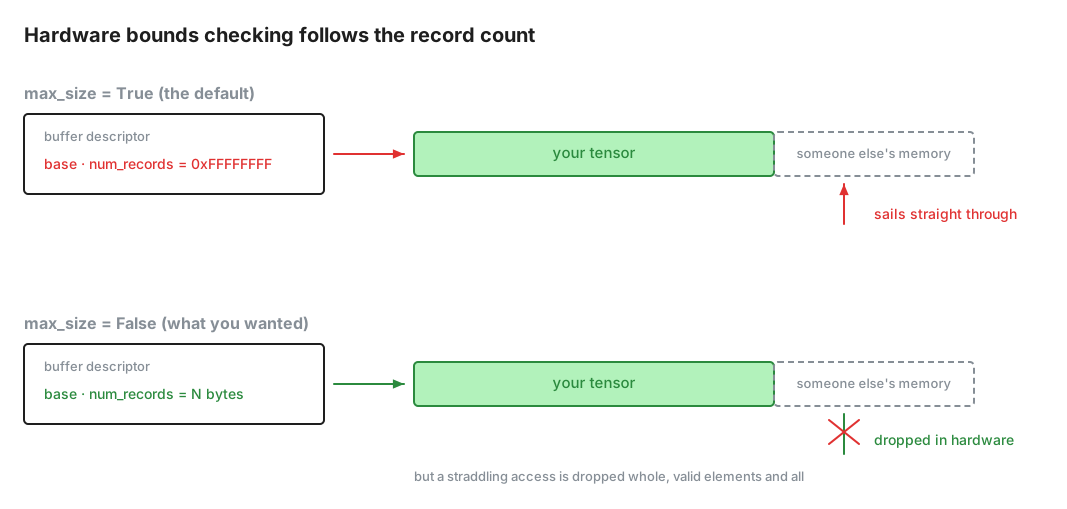
max_size=True sets num_records to 0xFFFFFFFF, so every address is in range and nothing is checked. With max_size=False the hardware drops out-of-range accesses, but drops straddling ones whole, valid elements included.That one is an ordinary out-of-bounds write, and the guard region caught it immediately. The interesting failure is the one hiding behind it.
3b. A straddling access is dropped, not clamped
With checking actually enabled, I expected pick_vec_width to become unnecessary — surely the hardware services the valid part of a straddling access. It does not:
| numel | divides by 8 | bytes past end | output correct |
|---|---|---|---|
| 100,000 | yes | 0 | yes |
| 4,257 | no | 0 | no |
| 1,023 | no | 0 | no |
| 7 | no | 0 | no |
The straddling access is dropped entirely, not partially serviced. Memory stays pristine; the valid elements inside that access never get written. Hardware range checking buys memory safety, not correctness — the width rule stays.
This is the one failure in the whole exercise that the guard region could not catch, and it is the mirror image of the other three: it corrupts the answer rather than the memory. Memory stays pristine — the guard tests pass — while elements that should have been written silently aren’t. It took the ordinary correctness tests, which had been quietly passing everything for days.
That’s why 3a and 3b are worth separating. They live in the same function call, one line apart, and they fail in opposite directions: 3a writes memory it doesn’t own while producing the right answer, 3b produces the wrong answer while touching nothing it shouldn’t. No single check finds both. The guard region catches writes you didn’t intend; the value comparison catches writes you intended and didn’t get. You need both, and this pair is the cleanest demonstration of why.
What I’d take away
The ladder for a memory-bound op is short. One optimization was worth 2.4×; the three rungs after it were worth 5% combined, and the two textbook ideas inside them — unrolling and non-temporal loads — both measured negative. If you want a kernel with a deep optimization story, pick one with reuse — a reduction, a GEMM — where blocking and shared memory have something to work with. ReLU’s ceiling is set by physics you cannot program around, and an arithmetic intensity of 0.25 tells you that before you write a line.
A passing test is not a correct kernel — know which mechanism made it pass. My 64× over-launch was covered by a predicate that happened to mask it, and it stayed covered right up until an unrelated change — widening the copy atom — pushed an index over 2³¹ and turned silent waste into a crash forty seconds into a benchmark.
Check the defaults. make_buffer_tensor offers hardware bounds checking and starts with it off. maximumf and torch.relu agree on every input except -0.0. Neither of these is hidden — they’re all right there in the signature or the semantics — but a layout DSL gives you enough rope that reading them properly is worth the ten minutes.
In a real model this kernel does not exist. ReLU never runs on its own — folded into the preceding GEMM’s epilogue it costs approximately zero instead of two bytes per element of HBM traffic. The best optimization available to a bandwidth-bound elementwise op is deletion, and it is worth more than every rung above.
Measure across shapes, not at one. The non-temporal store looked worthless at 8192² and was worth 21% two shapes later. One number is not a benchmark.
Next up: a reduction, where the ladder actually goes somewhere.
Further reading
- Simon Boehm, How to Optimize a CUDA Matmul Kernel — the two-dimensional version of this exercise, and the reason this post has the shape it does.
- FlyDSL — the DSL itself. Start with
examples/01-vectorAdd.py. flykernels— all five kernels, the sweep scripts, and the 284 tests.- AMD CDNA4 ISA reference — buffer resource descriptors, cache modifiers,
max_flat_workgroup_size. - Occupancy math on the MI355X — my earlier post on the resource limiters behind v3’s sweep.