Ragged MXFP8 Weight Gradients: A FlyDSL Grouped GEMM on MI355X
Every expert weight in a mixture-of-experts layer takes part in three grouped GEMMs per training step. Two of them look alike. The third, the weight gradient, does not. When this work started, the MXFP8 kernel serving it on ROCm ran at a fifth of the speed of the BF16 grouped GEMM it was meant to replace: the format that halves the bytes and doubles the matrix throughput was losing to the one it was supposed to beat.
TL;DR. In the weight gradient, the per-expert offsets cut the contraction axis, so every block reduces over an interval whose length is known only at runtime and whose start is only 32-aligned. My FlyDSL kernel keeps one block per expert per 256 × 256 output tile (no atomics, bit-reproducible output) and, at production token counts on synthetic routing, reaches 2,174 to 2,522 TFLOP/s on MI355X, 2.1 to 2.5× the BF16 hipBLASLt grouped GEMM (operator time on pre-quantized operands; quantization not included). The biggest wins came from cutting redundant scale loads (fewer load instructions and repeated lane addresses), not from hiding latency. At the top, the kernel sits on the part’s package-power limit, and the tile that would move fewer bytes doesn’t fit in the register file.
All numbers are from an MI355X unless marked as measured on an MI350X during development.
1. Why the weight gradient is the odd one out
Take one MoE layer. After dispatch, an expert-parallel rank holds the routed tokens X of shape [M, K], sorted by expert, and a vector offs records where each expert’s run of tokens ends. The expert weights are W of shape [E, N, K]. Per expert g:
- forward:
Y[g] = X[g] · W[g]ᵀ - dgrad:
dX[g] = dY[g] · W[g] - wgrad:
dW[g] = dY[g]ᵀ · X[g]
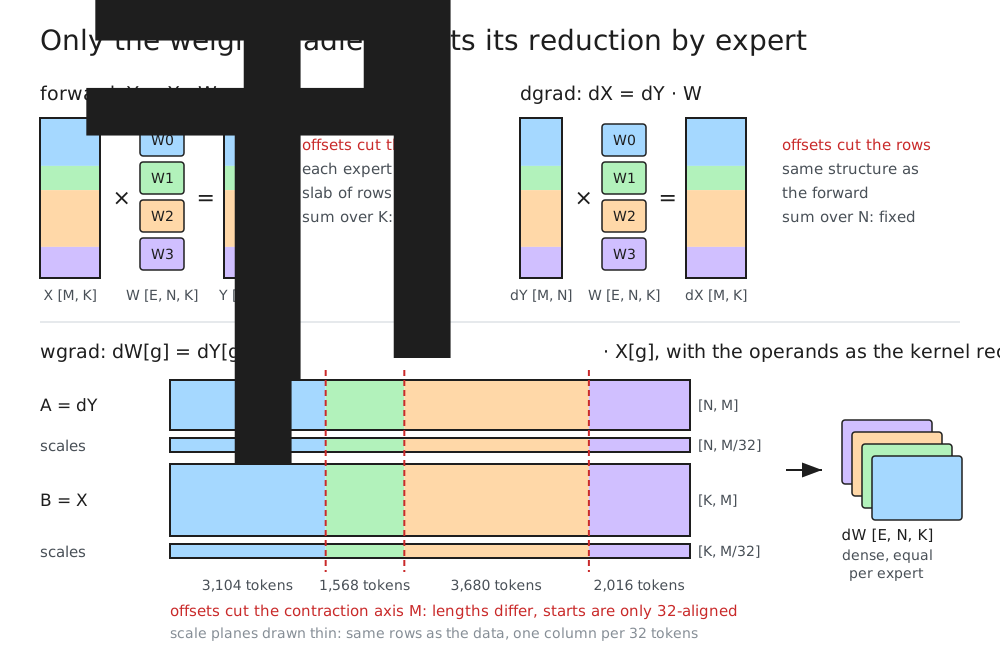
In forward and dgrad the offsets cut the rows. Each expert owns a contiguous slab of output rows, the contraction runs over a fixed hidden dimension, and a tile never crosses a group boundary. A grouped forward is just a batch of ordinary GEMMs.
The weight gradient cuts the contraction. dW[g] sums over exactly the tokens routed to expert g. The output [E, N, K] is dense and the same size for every expert; everything ragged is inside the reduction:
- The contraction length differs per expert and is known only at runtime. Under real routing the busiest expert on a rank holds 1.2 to 1.7× the mean, and an expert can get zero tokens.
- The contraction start is aligned to the 32-token MXFP8 scale block and nothing larger. A pipelined kernel walks the contraction in fixed steps of 128 tokens along
M. I call them K-steps, as GEMM kernels usually do, even though here they advance along the token axisM, not along the hidden dimensionK. A group rarely starts on a K-step boundary. - Every block of a long expert walks the same long interval, so whichever blocks run last decide when the kernel ends.
MXFP8 adds one wrinkle. It carries one E8M0 scale per 32 elements along the contraction axis, which for the weight gradient is the token axis. Both operands are therefore quantized along tokens, and the kernel receives A = dYᵀ [N, M] and B = Xᵀ [K, M] with the token axis contiguous, plus two scale planes [N, M/32] and [K, M/32]. On MI355X (gfx950) the input scale planes are plain row-major, so selecting expert g from any of the four planes is just a column offset. (The kernel later re-lays the scales out internally; see 5.6.)
2. Where I started
My starting point was a local Triton implementation of the weight gradient. I measure at two sets of expert shapes from torchtitan’s DeepSeek-V3 configurations: “16B” (N = 1408, K = 2048, 8 local experts) and “671B” (N = 4096 or 7168, 32 experts). At the 16B shape with 24,576 tokens per expert, Triton ran at 161 TFLOP/s on MI355X: about 3% of the part’s MXFP8 peak of roughly 5 PFLOP/s, and a fifth of the BF16 grouped GEMM (about 900 TFLOP/s on the same shape).
The obvious suspect for a slow ragged kernel is idle hardware. That didn’t look like the problem: the grid already had more workgroups (384) than compute units (256), and forcing Triton’s split-K path on made it 4% slower (July, MI350X, 1,024 tokens per expert). An ideal-reuse roofline points somewhere else.
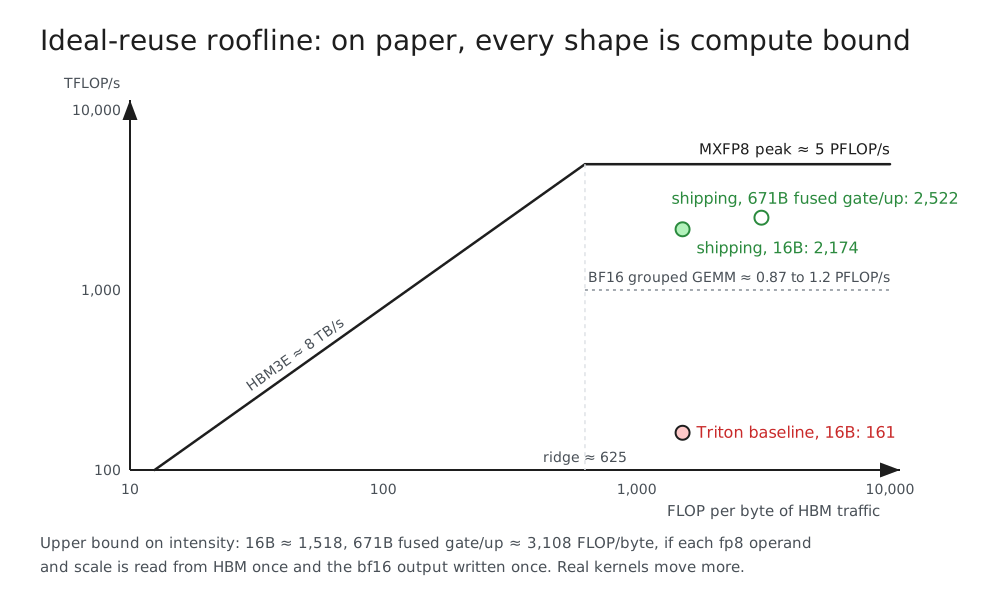
If every FP8 operand byte and scale is read from HBM once and the bf16 output written once, the 16B shape does about 1,500 FLOP per byte and the 671B shapes up to about 3,100, while MI355X’s ridge point (5 PFLOP/s over 8 TB/s of HBM3E) sits at about 625. That is an upper bound on intensity, since any re-reading lowers it, and I did not measure Triton’s actual HBM traffic. The 16B shape stays right of the ridge with up to about 2.4× the ideal traffic, and the 671B fused gate/up shape with up to about 5×. Either way Triton sat about 31× below the compute roof. My working hypothesis was that the loss was inside the tile: how each workgroup stages operands, how often it stalls, how many matrix instructions it issues per byte moved. The first FlyDSL body, below, tested that by changing only the tile body.
I wrote the kernel in FlyDSL, ROCm’s Python-embedded, MLIR-based kernel language, for four things it exposes:
- explicit LDS buffers with asynchronous loads into them;
- the scaled MFMA as an intrinsic, with control over which registers hold its accumulator;
- a way to assert that a value is the same across a wave;
- a compile key I control, so the token count and offsets stay runtime arguments and a new routing reuses the same compiled kernel.
3. Three hardware facts
Everything later refers back to these.
Eight partitions, eight private L2s. MI355X’s 256 compute units sit in 8 partitions (XCDs) of 32, each with its own 4 MB L2. Workgroups are dealt out to partitions round-robin by block index, so which blocks share a cache is decided by how the kernel numbers its blocks.
The register budget depends on how many waves share a SIMD. A wave alone on its SIMD gets all 512 registers per lane, and the compiler can pin the tile’s accumulators in the accumulator half (AGPRs), where the matrix instruction updates them in place. With four waves per workgroup, a 256 × 256 tile needs 256 FP32 accumulators per lane, exactly the AGPR half, and the shipping kernel uses 468 of the 512 registers with no spills. With eight waves, two share each SIMD and each gets 256 registers, so its 128 accumulators compete with operand fragments for the same space.
The scaled MFMA, and its layout. v_mfma_scale_f32_16x16x128_f8f6f4 forms a 16 × 16 output block over 128 elements of the contraction, applies both operands’ E8M0 scales per 32-element block, and accumulates in FP32. Dequantization costs no instruction. But the layout is not the one you would guess:
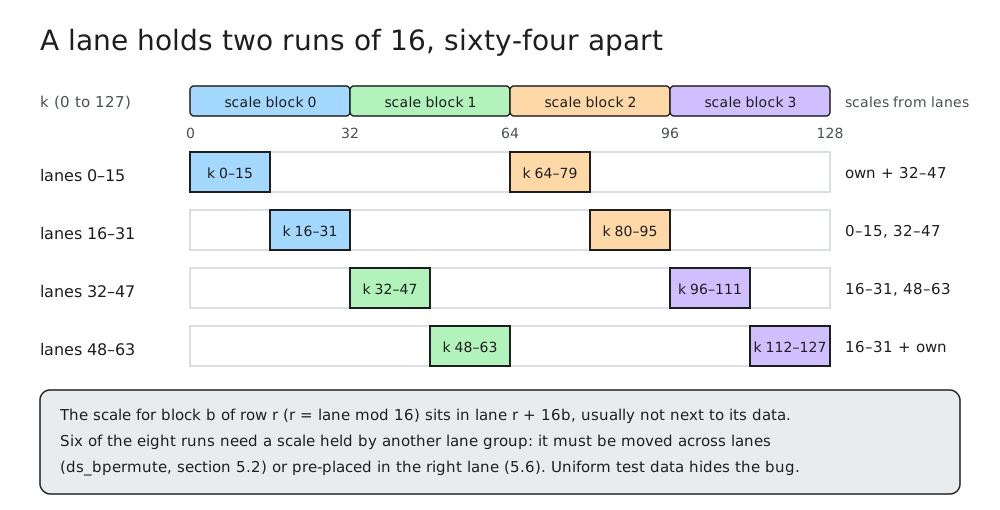
A lane does not hold 32 contiguous elements; it holds two runs of 16, 64 apart, so operand stripes must be laid into LDS in that interleaved order. And the scale for each run usually sits in another lane. A kernel that loads each lane’s scale next to its data passes tests with uniform data and gives wrong answers on real data.
One more property matters later: the scale operand is a 4-byte register, the instruction reads one byte of it, and a selector field (op_sel) picks which byte, independently for A and B.
4. The first FlyDSL kernel
The first kernel’s only job was to prove the diagnosis by changing the tile body and nothing else. It handled equal-sized groups only, with the group length as a compile-time constant.
The grid has one block per expert per 256 × 256 output tile, 8 waves each. A block owns its tile for life: it walks its expert’s tokens one K-step (128 tokens) at a time, keeps all 65,536 outputs in registers, and stores once at the end. No two blocks ever write the same output, so there are no atomics and the result is bit-reproducible. That property survives every later version, including the ragged one.
The body splits the tile into four 128 × 128 quadrants and double-buffers operand stripes in LDS (ping-pong: one set is read while the other fills). It also stages each block’s scales in LDS once, which caps a group at 2,048 tokens. The heart of the loop, trimmed (BLOCK_M is the K-step, and M here is the token axis):
for k in range_constexpr(K_ITERS - 2):            # one iteration = one 128-token K-step
    sa0, sa1 = load_sa(0, k), load_sa(128, k)      # this step's scales
    sb0, sb1 = load_sb(0, k), load_sb(128, k)

    b0 = b_s2r.load(b_cur0)                        # LDS -> registers
    a0 = a_s2r.load(a_cur0)
    a_g2s.load(a_next1, A1_gl + (k + 1) * BLOCK_M) # HBM -> LDS: issue, don't wait
    c00 = mma_scaled(a0, b0, c00, sa0, sb0)        # a cluster of scaled MFMAs

    b1 = b_s2r.load(b_cur1)
    b_g2s.load(b_cur0, B0_gl + (k + 2) * BLOCK_M)  # b_cur0 is now in registers: refill it
    c01 = mma_scaled(a0, b1, c01, sa0, sb1)
    # ... c10, c11 the same way, then swap the cur / next buffers
Each asynchronous load is issued right before a cluster of matrix instructions, so the copy completes while the matrix cores are busy, and each buffer is refilled, one or two K-steps ahead, the moment its contents are in registers. The scaled MFMA is the only arithmetic in the loop.
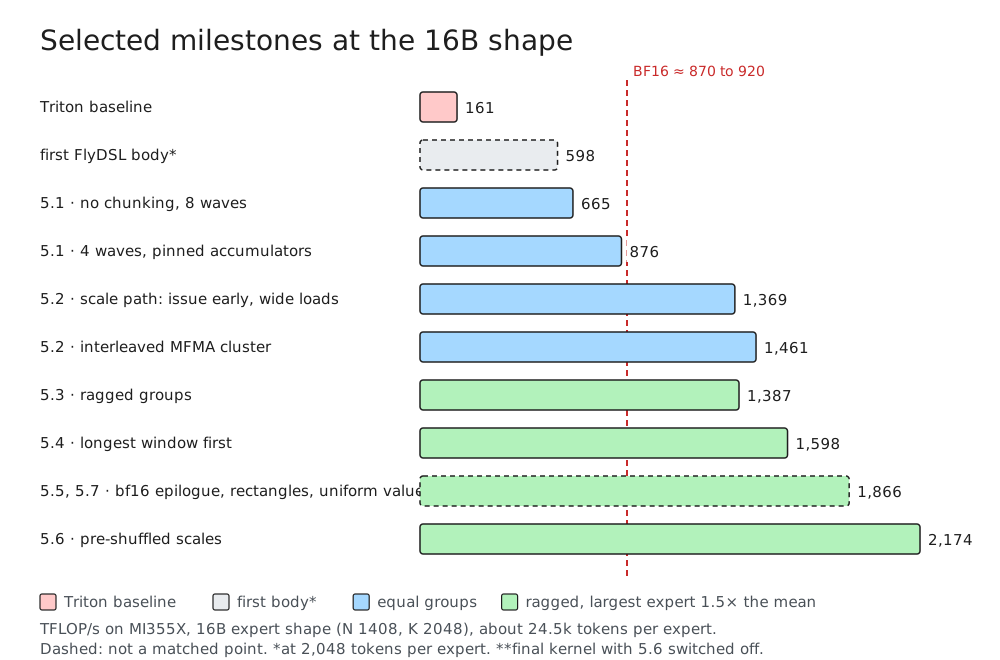
On MI355X it ran at 372 TFLOP/s at 1,024 tokens per expert and 598 at 2,048, 2.4× and 3.7× the Triton kernel at the same token counts (157 and 162 TFLOP/s), at identical numerics, on the same launch grid. Same work, several times faster from the body alone, which supported the hypothesis.
5. From 161 to 2,174 TFLOP/s
Each change below: what was wrong, what I changed, and what it measured. Unless noted, numbers are MI355X at the 16B shape with about 24.5k tokens per expert, and BF16 is hipBLASLt measured in the same process.
5.1 A pipeline that never restarts
Groups longer than 2,048 tokens had to be walked in chunks, and each chunk paid for its own pipeline prologue and drain; at real token counts that lost to BF16 outright. The fix was to stop staging scales and read them from HBM step by step, so one loop covers any length, and to make the K-loop a real runtime loop unrolled by exactly two (after two steps the ping-pong buffers are back where they started, so only the accumulators are carried across iterations). That loop, still with eight waves, ran at 665 TFLOP/s, 0.73× BF16.
Then four waves instead of eight: each wave gets a 128 × 128 quadrant and a SIMD to itself, which lets its accumulators be pinned in AGPRs so the compiler stops shuffling them between MFMAs. 665 → 876 TFLOP/s, 0.95× BF16.
5.2 The scale path
Reading scales every step put them on the same path as operand data, and they turned out to be the more expensive of the two.
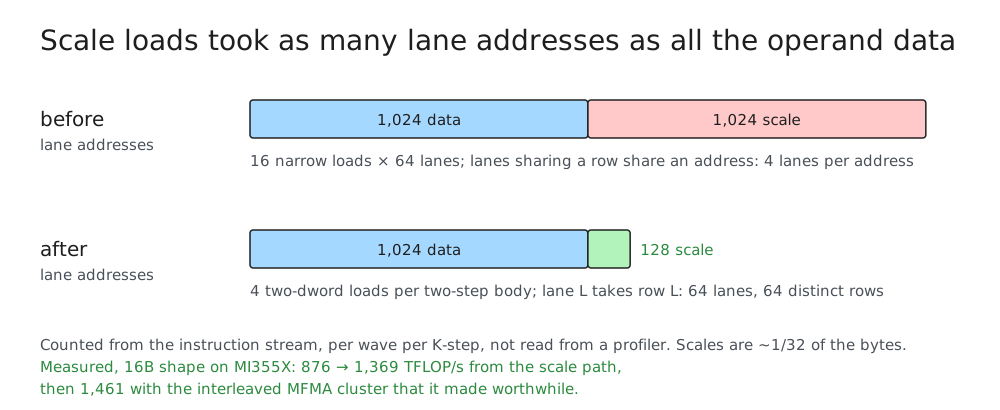
- Issue early, consume late. Load completions retire in issue order, and the scale loads were issued after the operand copies, so consuming a scale immediately compiled to a full drain of the memory pipeline every step. Raw scale words are now issued one loop body ahead and consumed a body later.
- K index in the scalar offset. The per-lane part of the address never changes and the K index is the same for the whole wave, which is exactly what the load’s scalar offset register is for.
- Cooperative wide loads. This is the one that mattered. Counted from the instruction stream, per wave and K-step, the scale loads presented 1,024 lane addresses to the vector memory path (16 loads × 64 lanes, only 16 distinct addresses each), as many as all the operand data (16 sixteen-byte copies × 64 lanes) while carrying about 1/32 of its bytes. I didn’t read these from a profiler; they follow from the load pattern. Now one two-dword load per operand half, covering both K-steps of the body, has lane
Ltake rowL: 64 lanes, 64 distinct rows. Each lane then fetches the scale its MFMA actually needs from a neighbouring lane withds_bpermute, which costs no memory traffic. The scale addresses fell 8×, to 128. - Interleave the MFMA cluster. Spreading operand refills between the matrix instructions had been measured neutral days earlier. With the address path no longer the bottleneck, the same change was worth 7%.
876 → 1,369 TFLOP/s from the scale path, 1,461 with the interleave: 1.59× BF16, bit-identical output. The two changes before the wide loads, aimed at latency, were worth a few percent between them; the wide loads were worth far more. My reading is that the cost was the volume of scale loads and redundant addresses rather than their latency. I didn’t isolate which stage of the memory path they loaded, so that part is an interpretation.
5.3 Ragged groups without touching the loop
The fast body assumed a constant length, a 128-aligned start and full K-steps. An earlier ragged kernel that gave up the pipeline to avoid those assumptions ran at half the speed on identical work, so the goal was to keep the body and pay for each assumption another way.
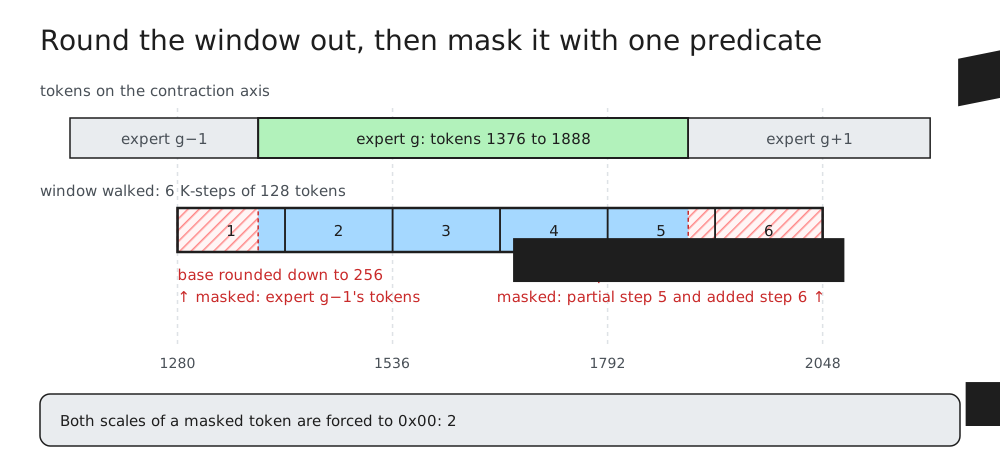
lo0    = (m_start // 256) * 256        # base rounded DOWN to the scale load's alignment
span   = m_end - lo0
k_need = (span + 127) // 128
k_even = ((k_need + 1) // 2) * 2
K_eff  = select(k_even < 4, 4, k_even)  # extended, never shortened: even, at least 4
Everything in the window that is not the group’s (leading tokens, the partial last step, the added steps, the whole window of an empty expert) is removed by one comparison per 32-token sub-block. Where it fails, both operands’ scales are forced to 0x00, which in E8M0 is 2⁻¹²⁷, so each masked product carries a factor of 2⁻²⁵⁴ and underflows to exactly zero in FP32. Masking A alone isn’t enough: 2⁻¹²⁷ times a large B scale can land back in range, and even with ordinary scales A-only masking moved a few bf16 outputs by an ulp in my tests. Experts that received no tokens also get an explicit exact-zero store. The mask rides the scales rather than the data because scales map to lanes simply and the data layout does not.
Two details cost real debugging. Scale masking only helps if the data is finite: the token dispatcher pads the operands past the last group, those columns held FP8 NaN in a real training step, and 0 × NaN is NaN. So the padding columns, data and scales, are zeroed in place before the kernel runs. And an out-of-range scale read of 0xFF is also NaN, so both scale planes get hard bounds, which I verified in the generated IR, not the source.
The block structure is unchanged, so still no atomics and still bit-reproducible, and the token count is no longer part of the compile key. On a ragged draw (195,840 tokens, busiest expert at 1.5× the mean): 1,387 TFLOP/s, 1.56× BF16, 5% below equal groups on the same total work.
5.4 Which block runs when
The hardware dispatches workgroups in block order, so block order is the schedule, and a long expert with a high index starts last and finishes alone.
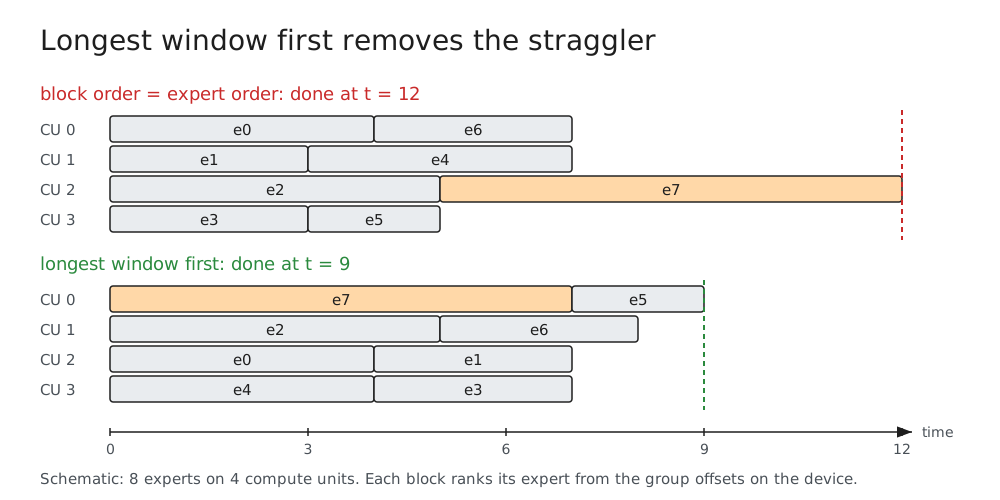
Longest first: slot d takes the expert with the d-th longest window. Every block computes the ranking itself, with E² scalar compares on the offsets it reads anyway. On the same ragged draw: 1,387 → 1,598 TFLOP/s, +15%. Over seven real routings (on MI350X) it was worth a median of 10.8%, enough that splitting long groups across blocks, which would bring back atomics, was never needed.
At 32 experts the trade flips. The ranking becomes 1,024 compares in the prologue of every one of 7,000 to 14,000 blocks, and with that many blocks the imbalance mostly averages out on its own, so ranking costs 7 to 13%. The shipping rule is one threshold: block order as-is at 1,024 blocks and above, longest first below.
5.5 Write bf16 from the register, walk tiles in rectangles
The epilogue wrote FP32 and the host narrowed it afterwards: at the 671B shape, a 3.76 GB plane read back and written again at 1.88 GB. The value is already in a register, so it is now narrowed there (round-to-nearest-even) and stored as bf16, bitwise the same result. Separately, the blocks resident on one partition formed a 1 × 32 strip of tiles; regrouped into 2 × 2 supertiles they form a rectangle and touch far fewer operand stripes.
At the 671B shapes the pair, together with 5.7, took the kernel from 1.33–1.49× BF16 to 1.76–1.85×. Taken apart, the epilogue is worth 17 to 27% at 671B (more at 127k tokens than at 258k, since the output plane does not shrink with the token count; 4% at 16B); the rectangles are worth 8% at 16B and nothing measurable at 671B, and are kept because they cost nothing measurable in my tests.
5.6 Pre-shuffle the scale planes
The sections are ordered by topic, not by date: 5.7 landed before this one. Four changes after 5.2, scales were the bottleneck again: a build with the scale path stubbed out ran 1.17× faster (August, MI350X). The load was cheap now; the unpacking was not. Each lane’s byte sat in another lane’s word, so every K-step spent 16 cross-lane permutes plus dozens of shift, mask and broadcast instructions to extract it, all in the middle of the matrix-instruction stream.
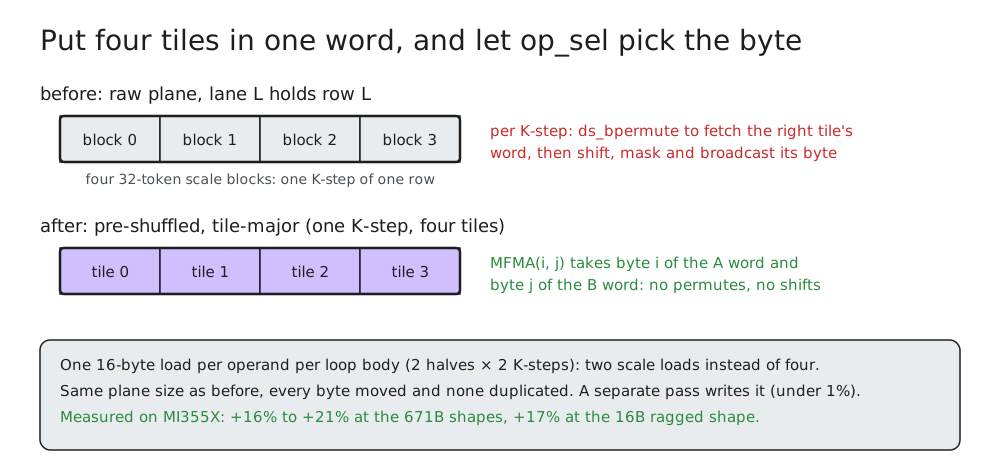
The obvious layout packs four K-steps per word, but with the loop unrolled by two that wastes half of every word and doubles the live scale registers. Instead the four bytes hold the four tiles of one K-step, and the instruction’s byte selector picks tile i from the A word and tile j from the B word. Both halves and both K-steps of a loop body fit in one 16-byte load per operand, two scale loads per body instead of four, and the inner loop keeps the loads and nothing else.
+18 to +21% at the 671B shapes (2,076 → 2,522 TFLOP/s on gate-and-up at 258k tokens) and 1,866 → 2,174 TFLOP/s at the 16B ragged shape. The 1,866 is the shipping kernel with only this change switched off, so the step from 1,598 to 1,866 comes from 5.5 and 5.7.
5.7 Tell the compiler what is uniform
Two hot-loop values are the same across a wave by construction, but the compiler couldn’t prove it. The LDS destination of each asynchronous fill cost a lane read, a no-op and a move before every fill, 32 extra instructions per loop body. Worse, the scale load’s offset made the backend wrap the load in a waterfall loop: a branch in the middle of the matrix-instruction stream.
; before (illustrative): the backend can't prove v5 is wave-uniform, so it loops until it is
BB_12:
  v_readfirstlane_b32 s20, v5
  v_cmp_eq_u32_e32    vcc, s20, v5
  s_and_saveexec_b64  s[22:23], vcc
  buffer_load_dwordx2 v[40:41], v3, s[16:19], s20 offen
  s_xor_b64           exec, exec, s[22:23]
  s_cbranch_execnz    BB_12

; after: one readfirstlane where the value is computed, outside the loop
  v_readfirstlane_b32 s20, v5
  ...
  buffer_load_dwordx2 v[40:41], v3, s[16:19], s20 offen
One readfirstlane on each value fixes both. On MI350X the main loop went from 377 to 328 instructions and vector registers from 228 to 212; on MI355X it is worth 3% of wall time at the 671B shapes. That sounds small, but at this level the kernel is power-limited, so every instruction that runs and doesn’t need to costs time directly.
6. What broke, and why
Between 5.5 and 5.7 I spent a week trying to break through the ceiling. None of the attempts beat the shipping kernel, and together they shaped my reading of what the ceiling is.
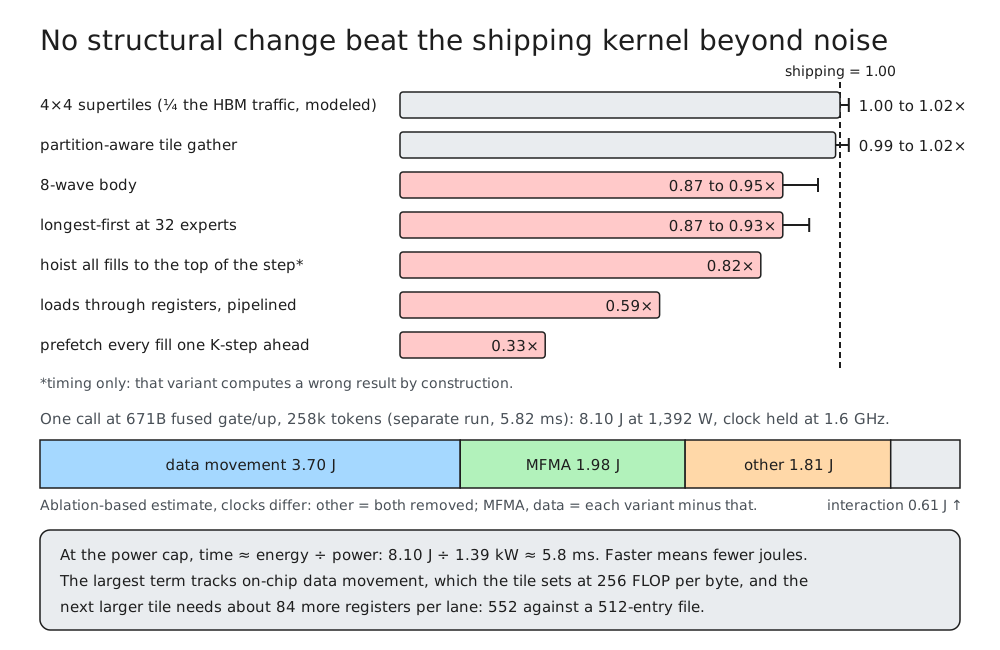
- Cache locality. 4 × 4 supertiles, which cut HBM traffic to a quarter by the tile-reuse model (I didn’t measure it with counters), measure 1.00 to 1.02×. Handing each partition a contiguous range of a group’s tiles measures 0.99 to 1.02×. The partition mapping had looked like a loss (−8 to −11%) while the FP32 epilogue’s traffic swamped it, then a gain (+3 to 8% on MI350X) once the bf16 epilogue was in, then a 1.6% loss after the scale pre-shuffle (also MI350X), and it was turned off. L2 hit rate is not the lever.
- Latency hiding. Hoisting all fills to the top of the step: 0.82× (timing only; that variant computes a wrong result). Staging loads through vector registers instead of loading straight into LDS: 0.59×. Prefetching every fill one K-step ahead: 0.33×. If delivery were purely latency-bound, putting another step’s bytes in flight should have helped; instead it tripled the time. Prefetching also changes register use, waits and instruction count, so it doesn’t isolate one cause, but all three results point the same way: delivery looked bound by the throughput of the memory path rather than its latency, and I stopped pursuing deeper pipelines.
- An 8-wave body: 0.87 to 0.95×, for the register reason in section 3. With half the registers, the 8-wave body can’t prefetch operand fragments, so the matrix cores wait on LDS reads. Forcing its accumulators into AGPRs doesn’t spill; it miscompiles.
- Longest first at 32 experts: 0.87 to 0.93×, the ranking from 5.4 applied where it doesn’t belong.
The most useful clue came from power, not time. At the 671B fused gate/up shape with 258,304 tokens, I ran the shipping kernel beside three stripped versions of itself, each for sustained back-to-back launches with clock and package power sampled: matrix instructions replaced by no-ops (keeping their register constraints); operand reads pointed out of bounds, so the hardware drops them before they reach L2 or HBM and returns zeros while the LDS traffic, barriers and matrix instructions stay unchanged; and both. This was a separate run from the results table. In it, the shipping kernel took 5.82 ms per call (the table’s run of the same shape measured 6.015 ms; separate runs vary by about 3%) and drew 1,392 W against a 1,400 W limit, with the firmware holding the clock at about 1.6 GHz, which is 8.10 J per call. Each stripped version rises to about 2.4 GHz. At the clock it actually ran, the shipping kernel is at about 77% of the matrix-core peak (2,606 TFLOP/s against about 3.4 PFLOP/s at 1.63 GHz). The 16B shape is in the same regime: its shipping run drew 1,383 W with the clock at about 1.7 GHz. When a kernel sits on the power cap, wall time is roughly energy divided by the cap. The experiments above kept or increased the instruction and traffic mix, so it is not surprising they didn’t get faster. For comparison, BF16 hipBLASLt spends 16.7 J on the same result.
I split the 8.10 J with a simple additive model. The version with both removed draws 1.81 J (barriers, LDS traffic, scales, the epilogue and static power). Putting the operand reads back adds 3.70 J; putting the matrix instructions back adds 1.98 J; the remaining 0.61 J is an interaction term. In the matrix-only version the matrix instructions run on zeros, and their energy depends on the data, so 1.98 J understates them and much of the interaction term is probably theirs. The stripped versions also run at a higher clock, so this is an attribution, not a precise accounting. By this measure about 46% of the energy tracks data movement, and that is not HBM traffic. Each block pulls its operand stripes from L2 into LDS and registers, and tiles that share a stripe each fetch it again, so the tile, not the shape, sets the ratio: a 256 × 256 tile does 2 · 256 · 256 FLOP for every 512 operand bytes it brings in, 256 FLOP per byte. At about 2.5 PFLOP/s that is about 10 TB/s of on-chip delivery, even though HBM itself moves far less. The most direct lever on that term is a bigger tile, and the next one the wave geometry allows (320 × 256) needs about 84 more registers per lane, 64 accumulators and some working space: 552 against a file of 512.
7. Results
The shipping kernel against the BF16 hipBLASLt grouped GEMM (torch._grouped_mm with both inputs 2D and a 3D output, one slice per expert) on MI355X. This is a pre-quantized operator speedup:
- Timed on the MXFP8 side: one call of the shipping kernel (AMD-TorchTitan-Ops at
9a9aa43, FlyDSL 0.3.0) on operands already quantized to MXFP8 in the token-major layout. The call includes zeroing the padding columns and the per-call scale pre-shuffle (about 0.04 ms at 671B). It does not include the quantization itself. - Timed on the BF16 side: one
torch._grouped_mmcall on the bf16 operands. - How: 3 s of back-to-back launches per variant with no per-call synchronization, two passes cycling all variants in one process, mean of the two passes, with clock and power sampled.
- Routing: synthetic, unequal group sizes on a linear ramp with the busiest expert at 1.5× the mean, each rounded to 256 tokens. Every group boundary is therefore 256-aligned; the next paragraph measures the unaligned case.
- Software: ROCm 7.2.3, hipBLASLt 1.2.70203, PyTorch 2.15.0.dev20260827+rocm7.2.
| shape | experts | tokens | BF16 ms | MXFP8 ms | MXFP8 TFLOP/s | speedup |
|---|---|---|---|---|---|---|
| 16B gate or up (unfused), N 1408, K 2048 | 8 | 195,840 | 1.270 | 0.519 | 2,174 | 2.45× |
| 671B gate+up, N 4096, K 7168 | 32 | 127,232 | 6.893 | 3.166 | 2,360 | 2.18× |
| 671B gate+up, N 4096, K 7168 | 32 | 258,304 | 12.852 | 6.015 | 2,522 | 2.14× |
| 671B down, N 7168, K 2048 | 32 | 127,232 | 3.510 | 1.648 | 2,266 | 2.13× |
| 671B down, N 7168, K 2048 | 32 | 258,304 | 6.745 | 3.086 | 2,458 | 2.19× |
Real routings put boundaries on 32-token multiples, not 256. To measure that path, I re-ran the three headline shapes with the same group sizes, shifting 32 tokens from the last expert to the first so that every interior boundary is 32-aligned but not 128-aligned. Every group then needs the rounded-down window, a partial leading K-step and a masked tail. Against the 256-aligned sizes timed in the same run, it costs 1.0% at 16B and 2.2 to 2.6% at 671B, leaving the speedup at 2.16 to 2.44×, with the same maximum relative error against FP32 (0.39%). Comparisons only hold within a run: separate runs of the same shape vary by 3 to 5%, and this re-run’s aligned control measured 671B down at 2.945 ms against the table’s 3.086.
An earlier sweep of a previous version of the kernel, also on MI355X (12 shapes, busiest expert at 1.38× the mean) spans 1.2 to 2.0 PFLOP/s and 1.7 to 3.0× BF16, and its controls say the ragged case isn’t flattering it. With uniform groups the 16B geometric-mean speedup falls from 2.38× to 2.24×, because hipBLASLt gains more from even groups; at twice-the-mean skew the kernel slows only 2 to 4%; and flushing caches before every launch leaves the ratio unchanged.
Correctness was gated on operator tests, not loss curves, which are far too noisy to catch a few wrong tiles. There are three separate checks:
- Run to run: repeated runs give bit-identical output, as they should with one block per tile and no atomics.
- Against other kernels: each performance change had to be bitwise identical to the version it replaced, and the ragged kernel with garbage written into the padding bitwise equal to the copy-based path (the same kernel on operands first copied down to their real token width, so there is no padding). Correctness fixes, such as masking both scales instead of only A, were checked against the FP32 oracle and the copy-based path instead, since they deliberately change what the version they fix produced.
- Against an FP32 oracle: every version was checked against a per-expert FP32 matmul of the dequantized operands before it was timed, with a maximum relative error of 0.39%, which is bf16 output rounding.
8. Availability and benchmarking
The kernel lives in AMD-TorchTitan-Ops (the numbers here are from commit 9a9aa43). A draft PyTorch pull request, pytorch#196883, vendors an earlier version (the one behind the 12-shape sweep in section 7) that lacks the scale pre-shuffle from 5.6 and is 10 to 17% slower at the 671B shapes. The benchmark harness, the raw results and the local Triton baseline aren’t public yet, and I’ll link them here once they are. FlyDSL compiles it per output shape and expert count, plus a couple of layout bits such as which scale-load variant the row stride allows. The token count and the offsets are runtime arguments, so a new routing at the same shapes reuses the compiled kernel. A framework layer on top, such as torch.compile, has its own shape guards and may still recompile when the total token dimension changes.
If you benchmark it yourself: run all variants interleaved in one process (a variant’s position in the sweep alone moved results by 20%), time sustained back-to-back launches rather than single synchronized calls, state the routing skew, and on a power-limited part sample clock and power with every variant, because two variants at different power are two variants at different clocks.
9. Lessons
- Count loads and addresses, not just latency. The biggest step came from noticing sixteen narrow scale loads in which every address was repeated by four lanes. Each experiment I ran that put more bytes in flight made things slower.
- The register budget depends on wave geometry. Four waves gave each wave the whole file and an AGPR half for its accumulators; eight took both away. Nothing in the source says so.
- Measure the second change with the first one in. A negative result taken while a bigger term is in the way is not a result.
- Gate on bit-exact tests, and on joules. Loss curves are too noisy to gate a kernel, and on a power-capped part a wall-clock difference between two variants is often just a clock difference.
The raggedness lives inside the reduction, and the kernel handles it there.
Feedback? Thoughts? Find me on LinkedIn or GitHub.
Cite this post
If this post helped your research, please cite it as:
Pandey, C. S. (2026, September 27). Ragged MXFP8 Weight Gradients: A FlyDSL Grouped GEMM on MI355X. indianspeedster.github.io. https://indianspeedster.github.io/blog/mxfp8-wgrad-grouped-gemm/
Or with BibTeX:
@misc{pandey2026mxfp8wgrad,
  author       = {Pandey, Chandra Shekhar},
  title        = {{Ragged MXFP8 Weight Gradients: A FlyDSL Grouped GEMM on MI355X}},
  year         = {2026},
  month        = sep,
  howpublished = {\url{https://indianspeedster.github.io/blog/mxfp8-wgrad-grouped-gemm/}},
  note         = {Blog post}
}